Visualizer
Argonaut converts execution traces into interactive visual analytics. The visualizer exposes topology structure, local cost, complex cost, global cost convergence, plan changes, and comparative views of optimization outcomes.
Open Visualizer
After a successful run, click Open Visualizer.
Tree-Based Visualizer
The Tree-Based visualizer opens as an overlay. It contains:
A topology graph of agents and parent-child relations.
Experiment selectors for agents, plans, simulation, and weights.
Tree type controls.
Single and Compare view modes.
Color controls for Complex Cost, Local Cost, and Unfairness.
Iteration controls for All and Key Changes.
Playback controls, previous/next controls, and an iteration readout.
A current-state table with agent, plan, and the selected cost metric.
Charts for global cost, complex-cost convergence, global response vector, and local cost vs agents.
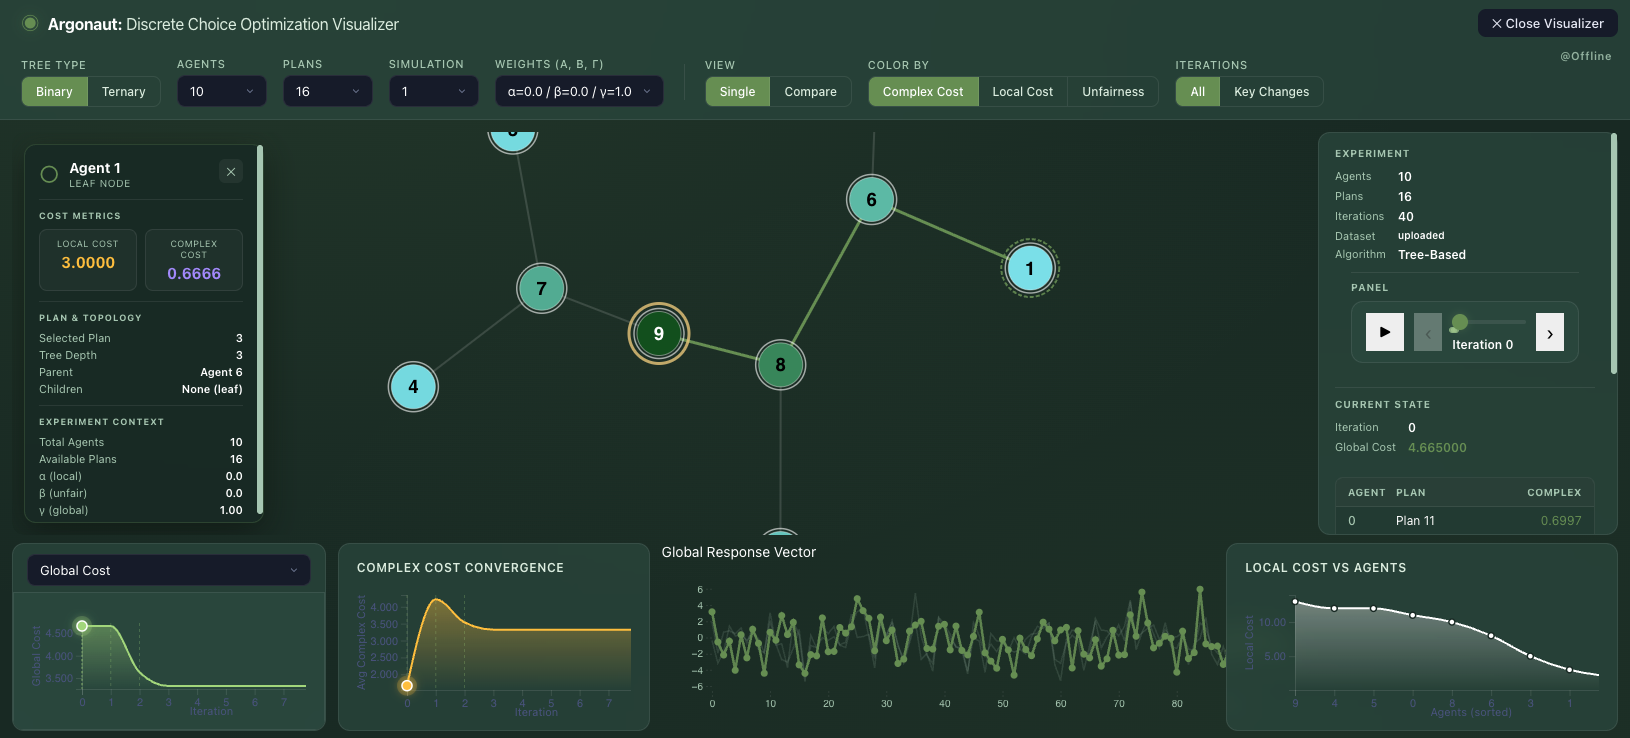
Single mode (10 agents, 16 plans, 100 dimension) shows one topology and one current iteration state.
Node Clicks and Drags
Clicking an agent node opens a detail card. In the tested Tree-Based visualizer, the card contained:
Agent identifier.
Whether the node is a leaf node.
Local cost.
Complex cost.
Selected plan.
Tree depth.
Parent.
Children.
Total agents and available plans.
Objective weights.
Dragging on the topology pans the graph layout. It does not change selected plans, cost values, or optimization results.
Iteration Controls
Next advances one iteration. Prev moves back one iteration. Play automatically advances the trace and changes to a pause control during playback.
All exposes the full iteration range. Key Changes filters the playback range to iterations where selected plans changed. In the tested Tree-Based run, Key Changes reported one key change at iteration 0.
Note
In the tested deployment, previous/next and play were reliable. Direct dragging of the small iteration slider did not visibly update the current state in the browser session, so previous/next and play are the recommended controls for iteration navigation.
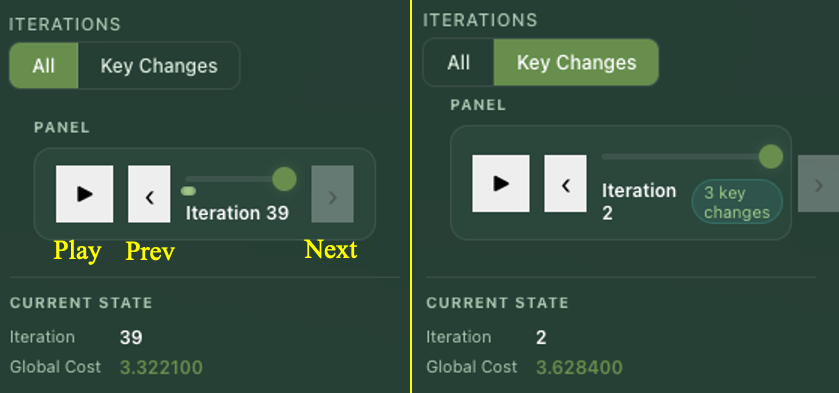
Two modes that control iterations.
Compare View
Compare mode renders two topology panels side by side. It also changes the panel table from one current state to a comparison table with:
Iteration A and cost A.
Iteration B and cost B.
Agent rows with Plan A, Plan B, Cost A, and Cost B.
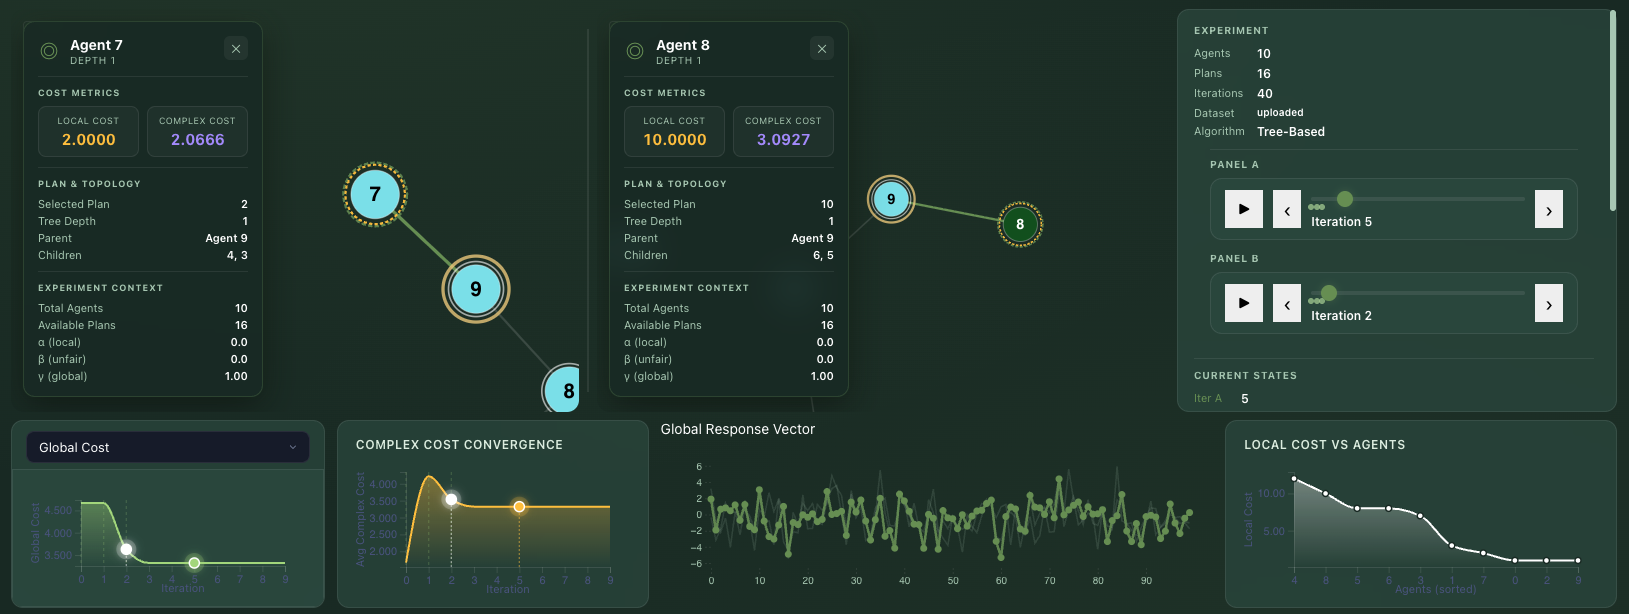
Compare mode places Panel A and Panel B beside each other for side-by-side inspection.
Brute Force Visualizer
The Brute Force visualizer is a separate overlay. It shows one solution-space tuple at a time, its global cost, and a radial visualization. Prev and Next navigate through the enumerated solution space.
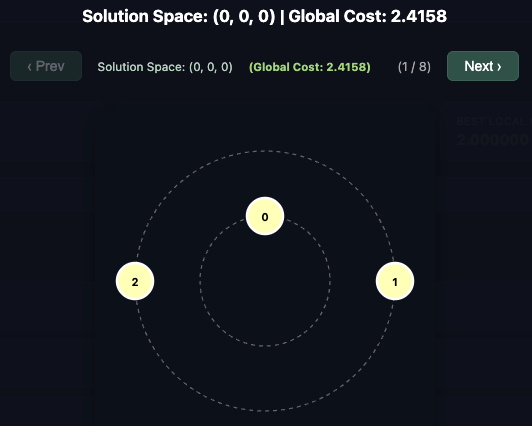
Brute Force visualizer navigation moves through all enumerated collective solutions.
In the tested Brute Force run:
The first view was
Solution Space: (0, 0, 0).Clicking
Nextmoved toSolution Space: (0, 0, 1).The page indicator changed from
(1 / 8)to(2 / 8).Clicking or dragging radial graph nodes did not open extra details or change the tuple.
Combined Visualizer
Both mode opens the Tree-Based visualizer and adds Brute Force comparison values to the state panel:
Best BF GC.GC Rank.
In the tested combined run, the Tree-Based solution had rank 2 / 8 against the Brute Force solution space.
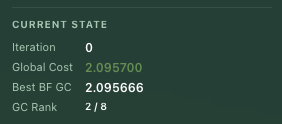
In combined mode, the Tree-Based visualizer includes Brute Force comparison values and the rank.